Five Millimeters at the Price of 80 Million Euros

Small decisions in product development often have unpredictable consequences. Knowledge graphs help to make complex relationships more transparent.

An automotive supplier commissions the development of a new camshaft for a newly optimized engine type. The camshaft is five millimeters longer than the previous generation, meets all product requirements and fits into the engine after testing. Material costs – a few euros. In an ideal world, this is how development could work. Unfortunately, however, our world is much more complex than this idealized scenario. The developers did not realize what the five millimeters difference in length would mean for other areas of the company. In logistics, fewer shafts can now be transported on each trip, and the existing workpiece carriers no longer fit, either. A new logistics concept is needed. The production department also runs into problems with the new generation. The previously used machine can no longer produce the shaft – the search for a replacement is launched. But will an expensive new machine fit into the budget for production planning? 

© Fraunhofer IPK/Larissa Klassen

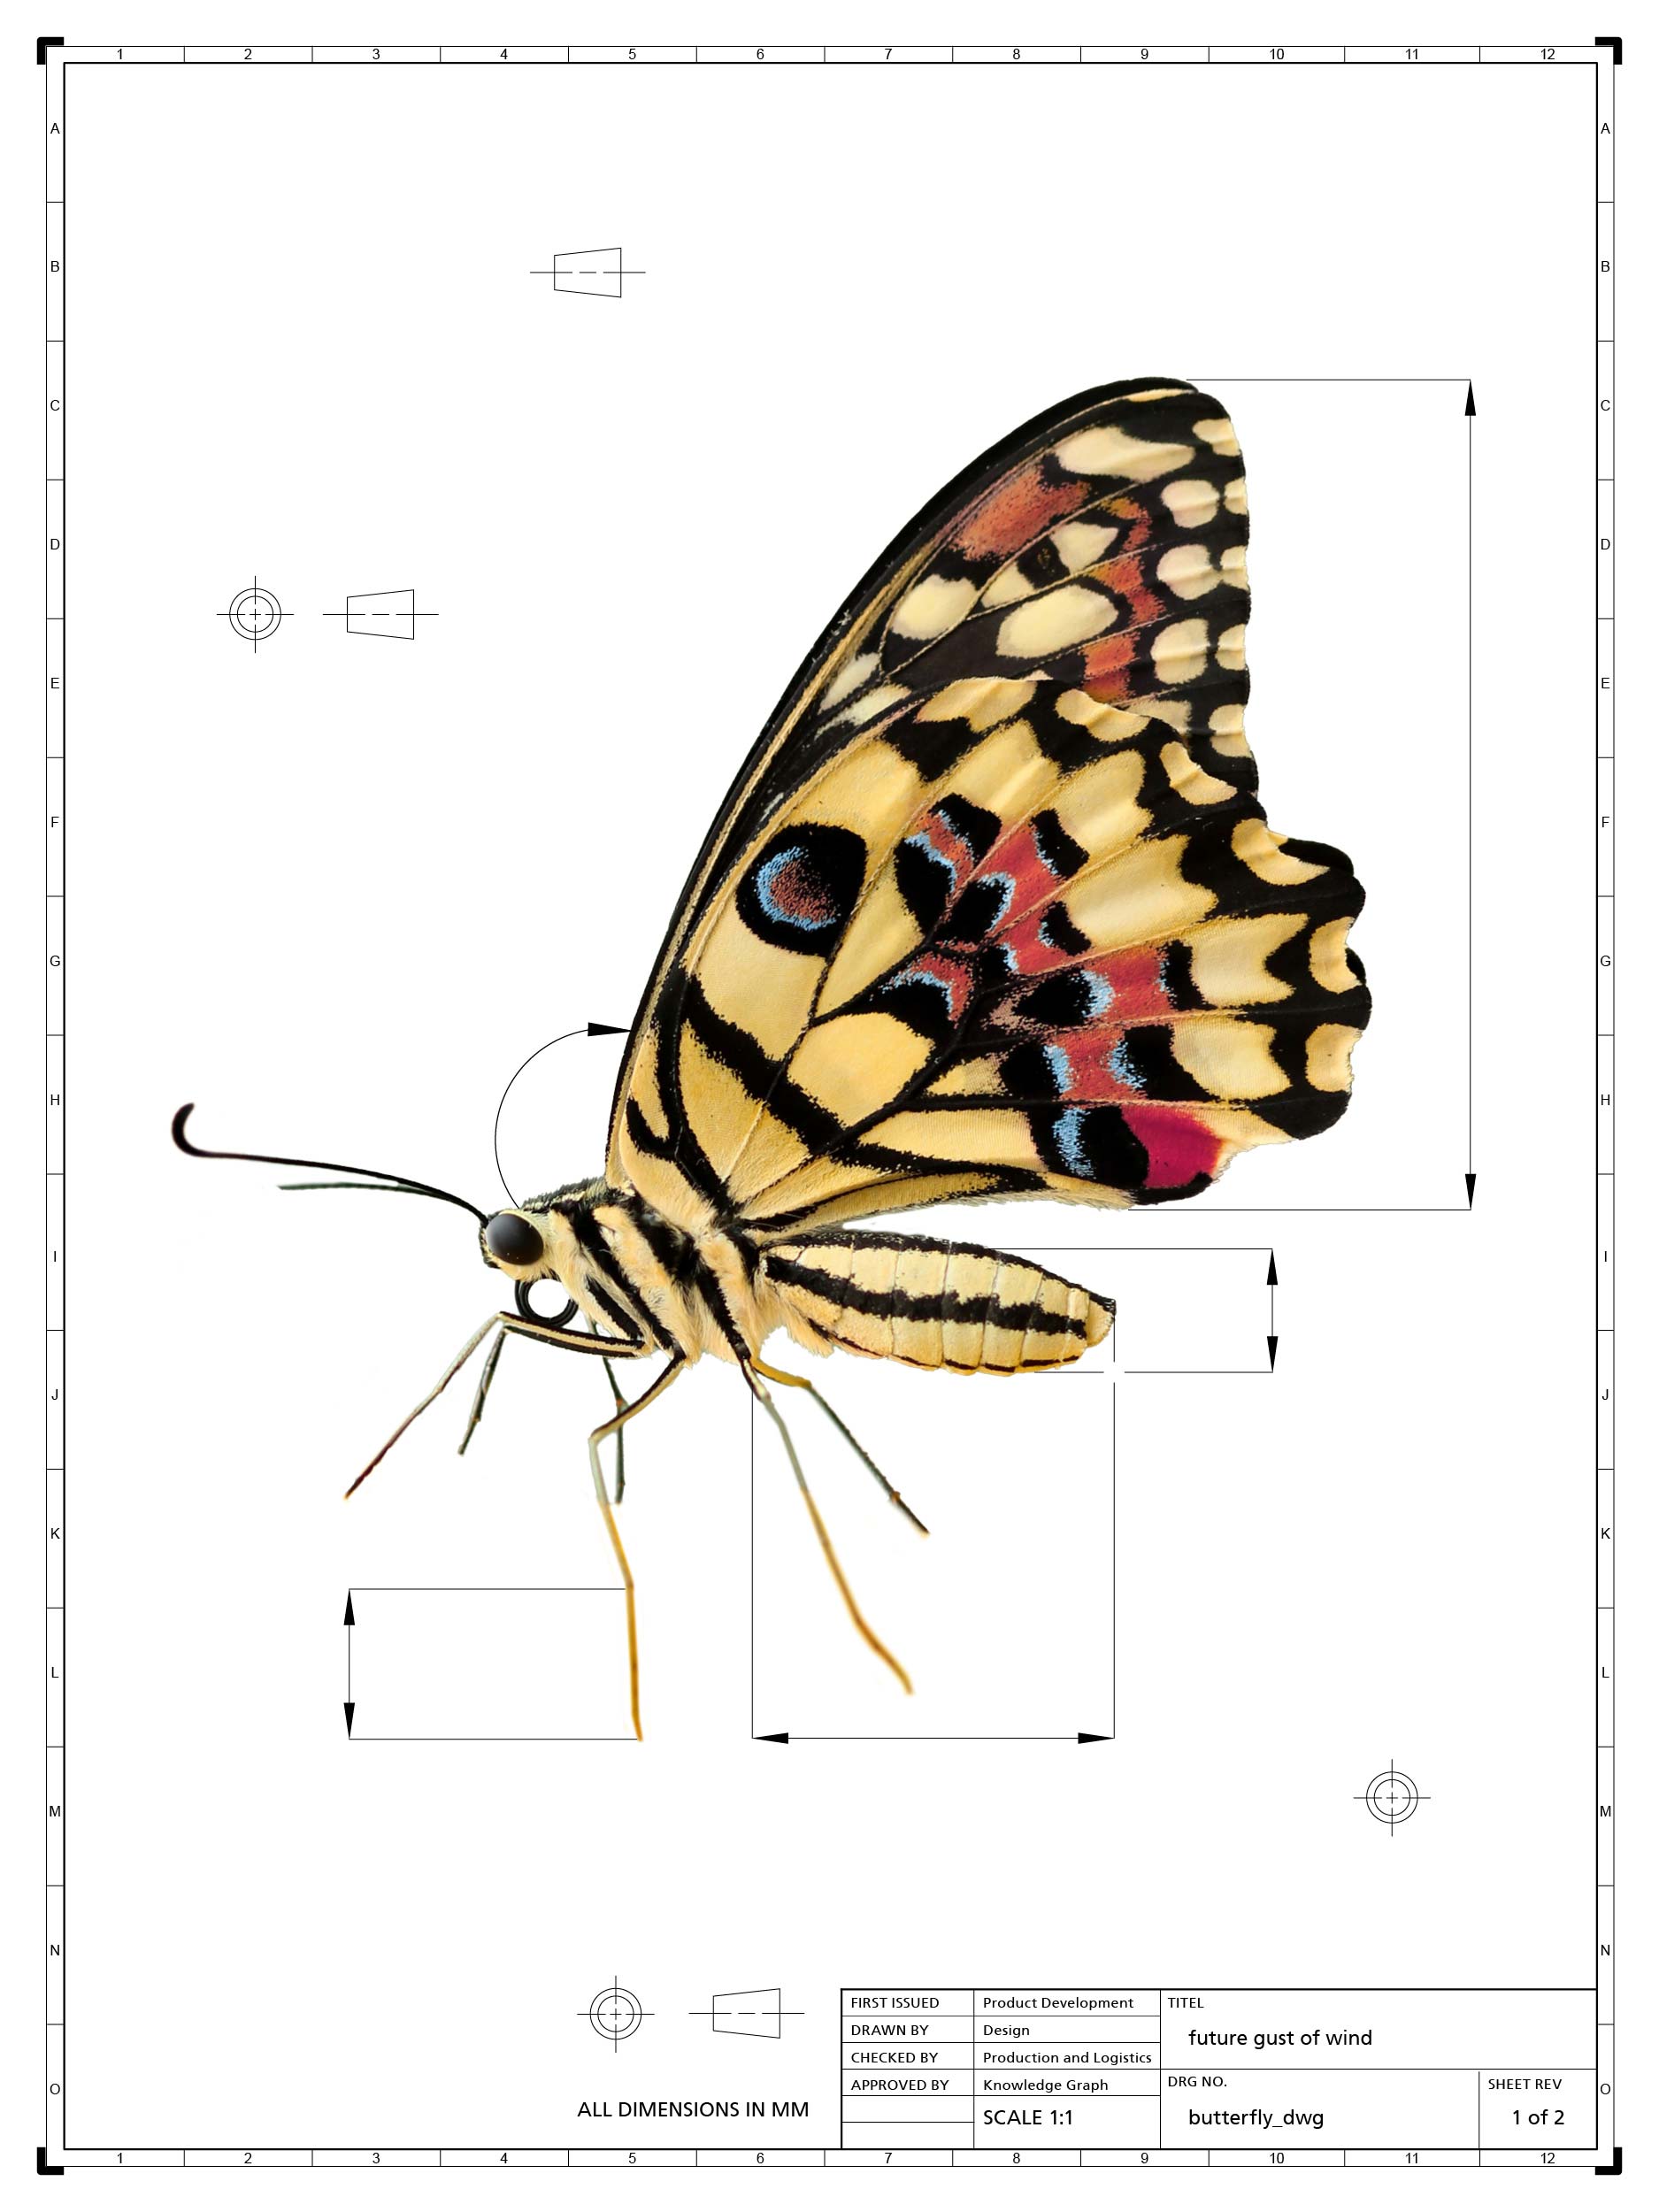
The butterfly effect

You might have heard of the metaphor of the butterfly that can cause a tornado on the other side of the world by flapping its wings. The consequences of a small change in a complex system are often vastly underestimated. Our example company’s product development team could not foresee the many challenges associated with their decisions, as these dependencies can often only be assessed by technical experts for the individual process steps. Although individual relationships can be modeled in IT systems, there is generally no link whatsoever between these information models. There are many reasons for this: There are no interfaces to the IT system, each system uses its own language for modeling and data storage. Process-related and organizational responsibilities between the departments are not very transparent, and knowledge holders are difficult to identify. As a result, approvals are often issued at the level of individual components or assemblies, whereas broader relationships between these levels can be overlooked. A holistic review often takes place only after months of development work, when the first prototypes are evaluated.

The roundtable

As soon as problems are identified in these prototype tests, the departments involved would traditionally sit around a table and try to find a solution. It may turn out that the shaft can be made shorter by three millimeters if another component is adapted accordingly. That is one way to solve problems – not efficiently, but effectively. Above all, however, this process is reactive and therefore time-consuming, and time is money in product development. 

All the information needed to anticipate the problems that would arise later was essentially already available in the company. It was just not adequately prepared and available in the right place at the right time. Our company therefore has an essential interest in improving the collaboration of its employees in terms of creative problem solving and ultimately innovative value creation. The question now becomes: How can we facilitate the exchange of information and knowledge between the individual departments?

The key lies in processing the information in such a way that it provides clues to the dependencies, in this case the logistics problems resulting from the longer camshaft. Knowledge graphs offer one way of doing this. With their help, the contexts of the systems involved can be linked and complex questions answered. Implicit knowledge, such as logistical, technical or organiza­tional and process-related relationships, can also be mapped and thus explicitly formalized. Knowledge graphs hence offer a structured and networked perspective on existing knowledge and make it possible to provide information in a context-sensitive manner. They support product development teams by allowing efficient and flexible integration of data from different sources and making it interpretable for queries.

From data to knowledge

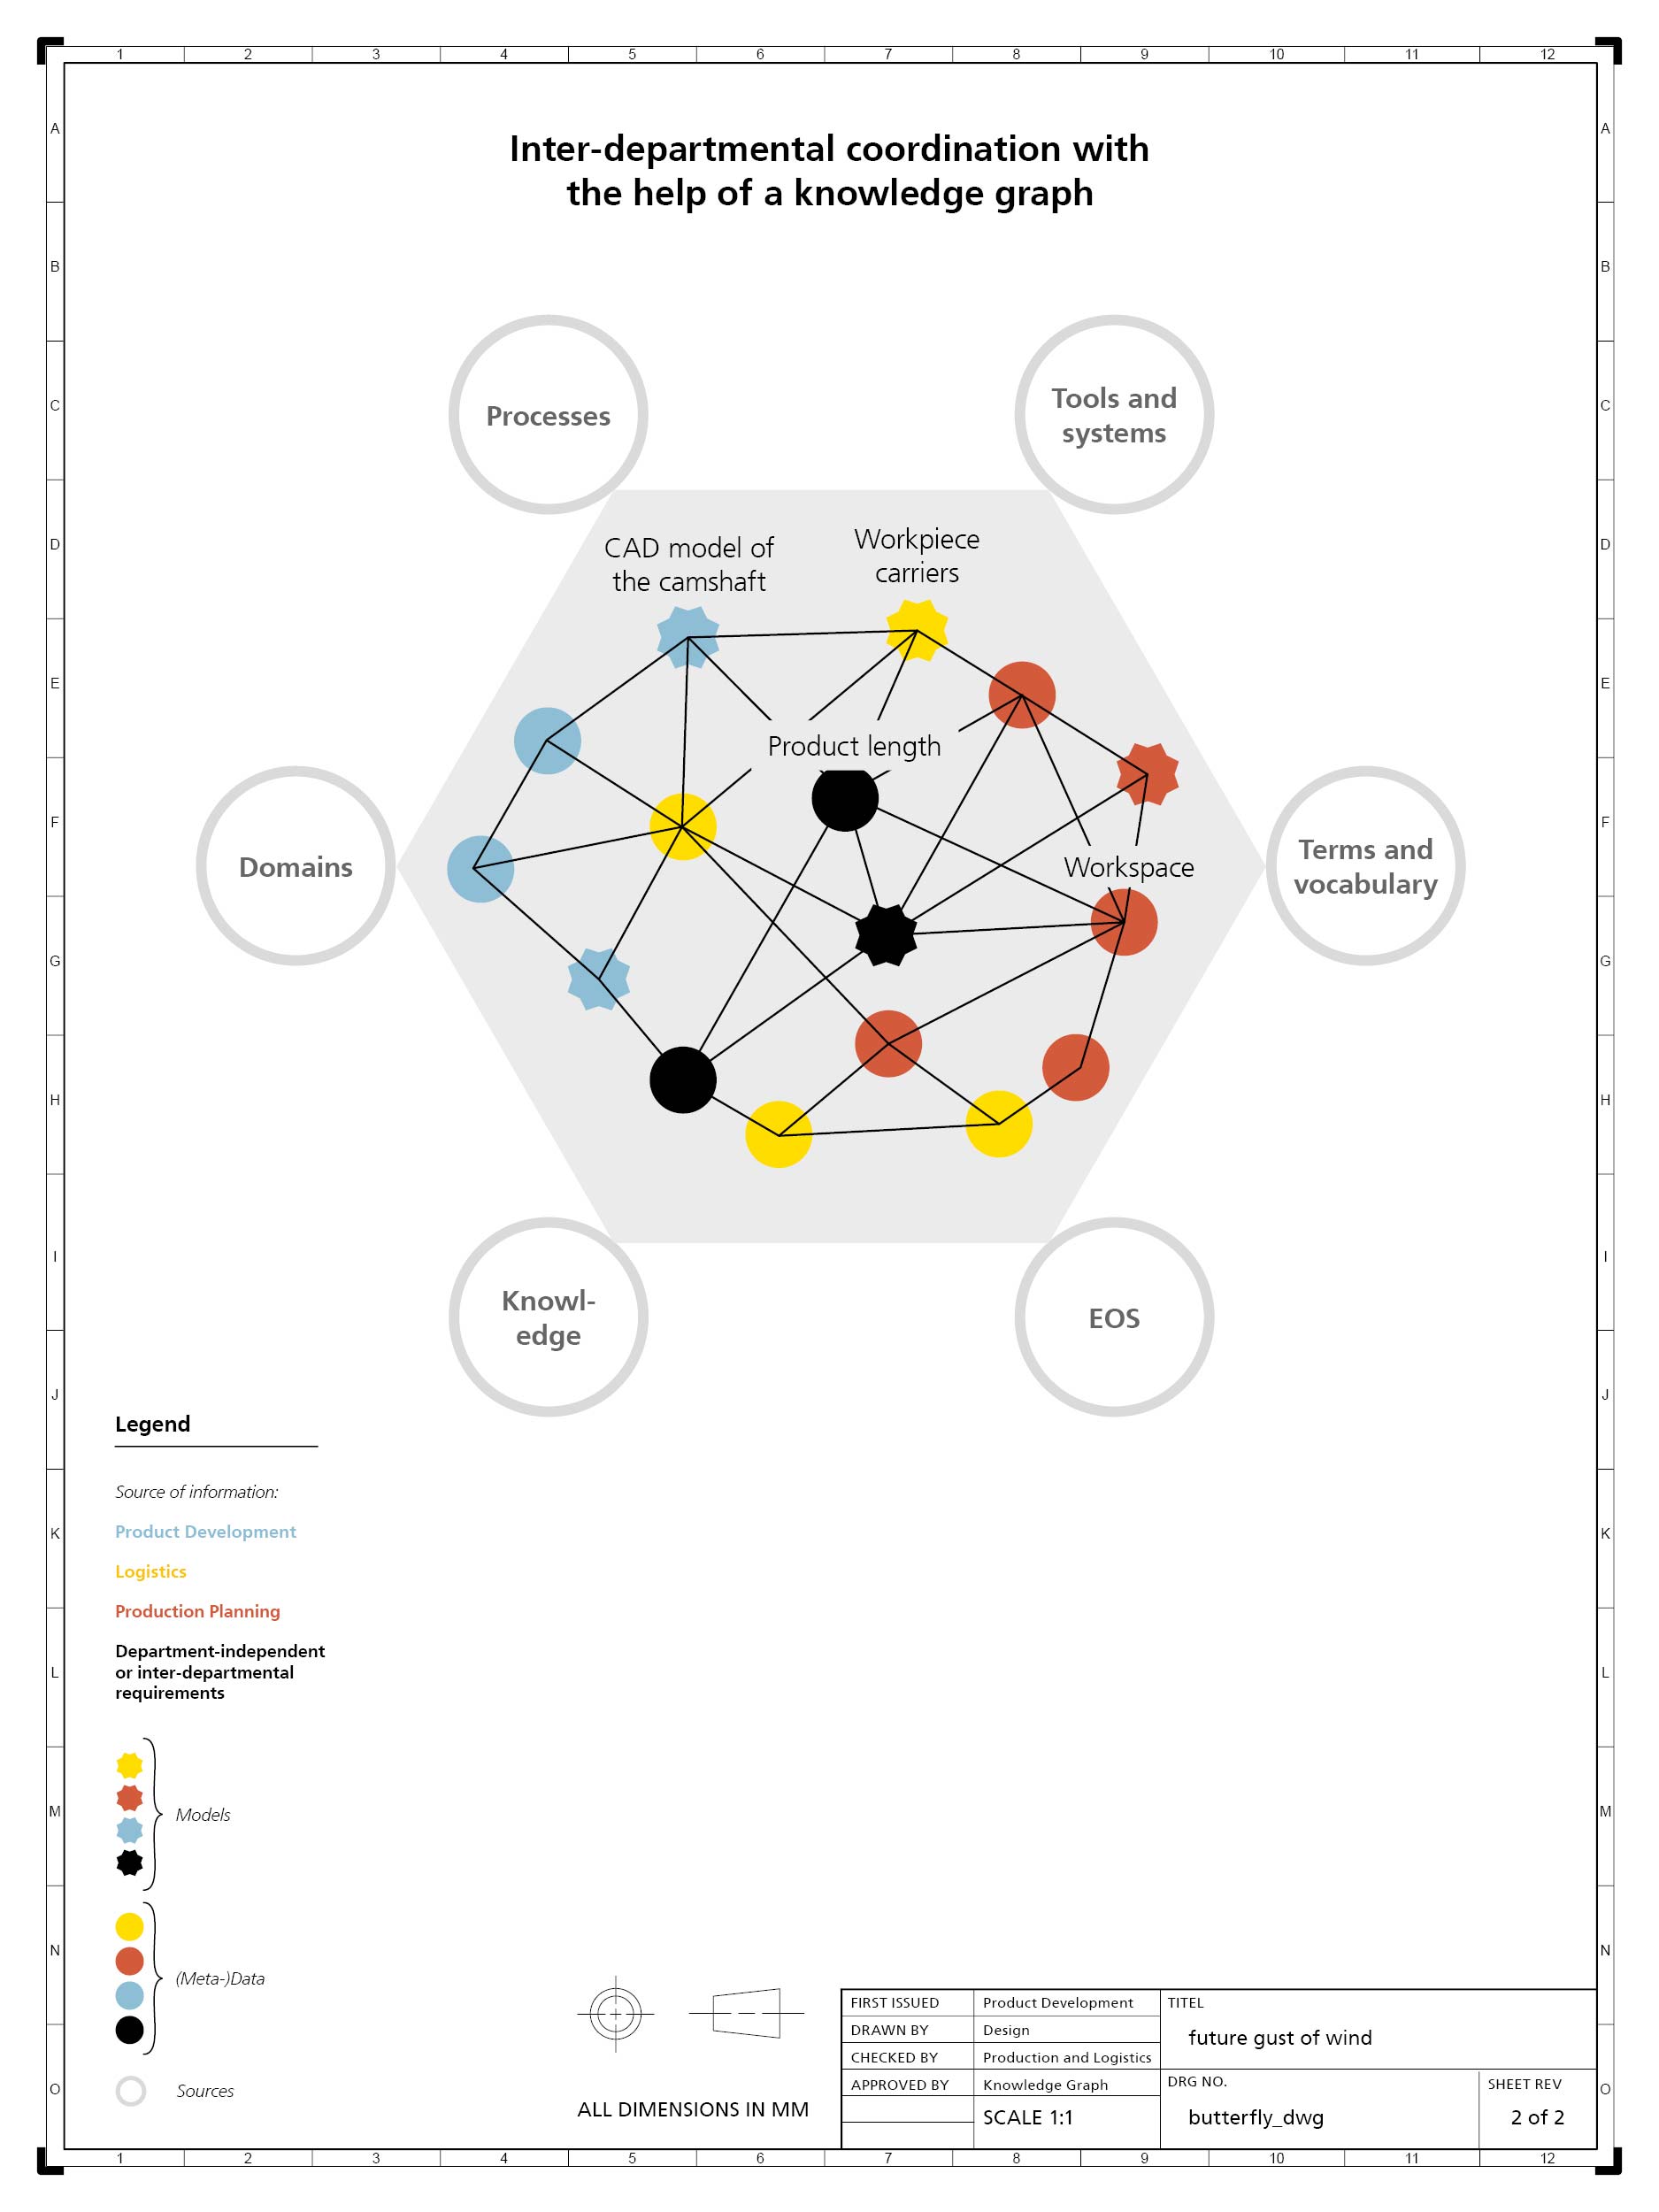
To model specific contexts in knowledge graphs, different classes of information (nodes) are created and connected to each other with relations (edges). Nodes and edges can be enriched with additional information. This creates formal descriptions and information links that can be machine-read and interpreted. In our example, a node for the camshaft could be created and enriched with corresponding information, such as its overall length. Important relations to other nodes and the information describing them in more detail are then modelled, for example the workpiece carriers in logistics with their maximum transport width or the machine in production with its workspace. The involved experts determine and formalize which nodes, relations and information are critical, so that the information and links contained in the knowledge graph can be converted into corresponding assistance functionalities. This could include guidance on changes to the design or the identification of a solution space.

As the example shows, individual pieces of information can come from different sources. A graph can initially be created as an empty reference model and the actual information can be provided by the systems integrated into the graph; the graph thus forms a common language for information from all systems. There are different approaches to integrating information according to the respective requirements and strategy. Depending on the context, integrated data can be enriched with additional information and relations. Knowledge graphs, therefore, not only enable the creation of cross-system contexts; these contexts can also be extended individually beyond the system data. 

© Fraunhofer IPK/Larissa Klassen

Towards implementation

The modeling of knowledge graphs is very application-specific and therefore requires a great deal of contextual knowledge. First, relevant information from the individual systems must be identified and modeled. The individual data points must then be linked to describe their relations to each other. In addition, an individual context expansion is carried out based on the questions at hand and the requirements for the assistance. 

This sounds time-consuming, but offers various advantages: Information can remain in its source systems despite the use of knowledge graphs while existing infrastructure and systems can continue to be used productively. In addition, the individual expansion of information and the associated gain in knowledge for specific questions facilitates the targeted use of existing data. Knowledge graphs can grow and continue to integrate additional sources for new questions. They are machine-readable, which means that they can also be used for the automated integration of systems with each other.

Knowledge graphs thus support the exchange of information and communication between our company’s employees and systems – so that when the next product is developed, they can make well-informed, forward-looking decisions. And the butterfly flutters on.